Observations, explanations and confidence
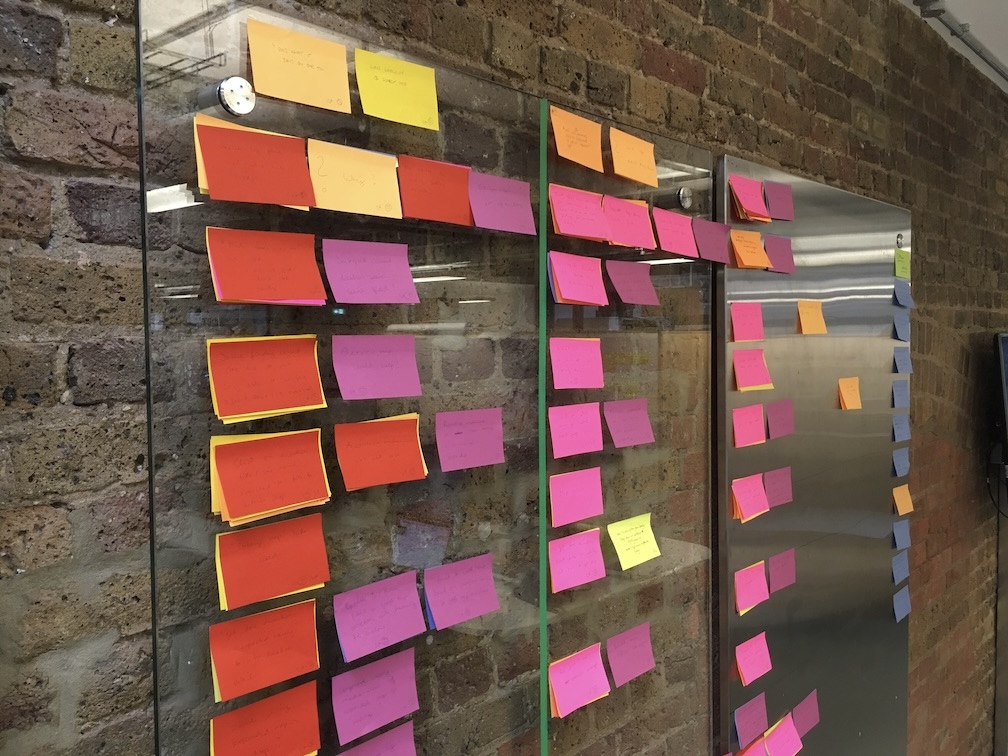
We’re in the process of creating an alpha for the store locator on Tesco.com, and we’re getting pretty close to the point where we’re ready to move into beta. For the last couple of weeks we’ve been building a prototype in the browser that allows us to test the decisions we’ve been making about the UI and to make sure we’re reducing the risk around moving into beta and production code.
Early last week, the team watched our researcher take people through some familiar scenarios in the browser and used a simple framework to collaboratively capture observations and insights from each session. As customers worked with the different variations of the alpha, the team wrote down positive, neutral and negative observations along with emergent research questions on colour coded Post-its which after each session were talked through and grouped on the wall. As you’d imagine, this method drives out a lot of observations and we weren’t exactly short by the end of the two days.
In the process of reviewing the work, I’ve noticed that while we’re doing a good job of rolling this product forward and we’re improving the experience we’re giving our customers, we might not be being as effective as we can be in meeting one of the higher purposes of product designers which is to continually create better explanations of customer behaviours and their needs. If we don’t have solid, defensible explanations for why customers behave in specific interactions with our products, we’re at risk of jumping into the wrong solutions. In the spirit of continuously improving our working practices, we’re going to try out a revised summary report for product testing.
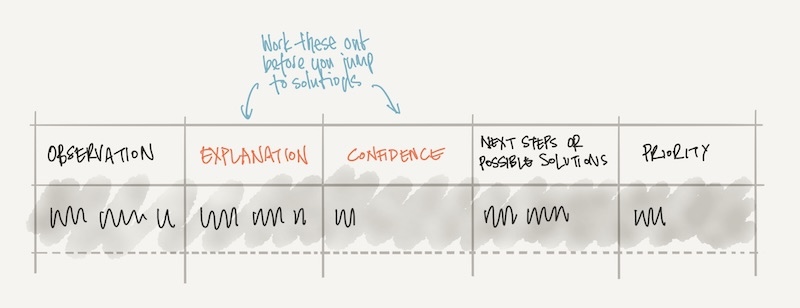
The act of creating explanations also requires us to state our confidence in those explanations: when we notice that customers are struggling to zoom in on maps in a UI we could explain this in several ways: the map is too small, the affordance to access a larger map is being missed, the gesture to zoom the map is unknown to the customer, or even that the scenario we’re looking at is biasing our research towards an unnecessary map interaction. For each of those cases, we can make assertion about how confident we are as a team with this explanation.
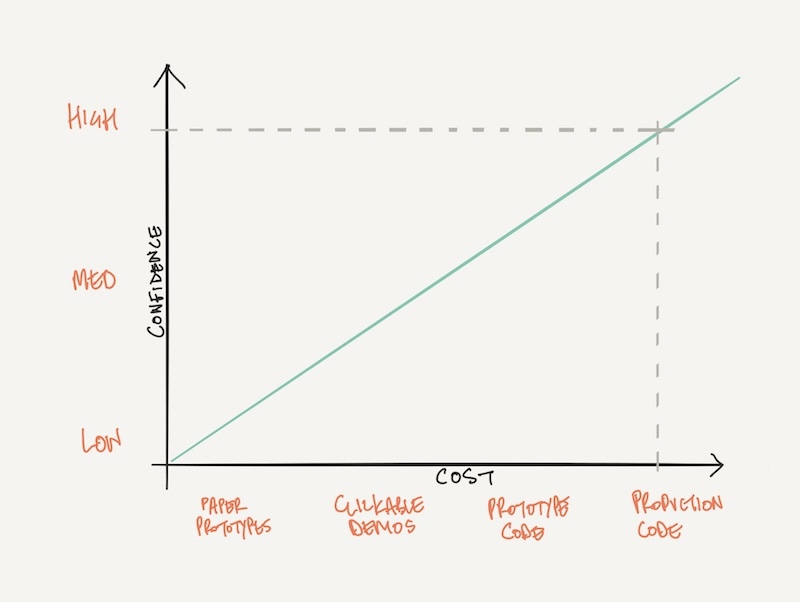
A statement of our confidence in any given observation allows the team to make a decision about whether we need further research, and also helps us decide what kind of testing at what fidelity we need.
One final point: even when we’re making positive observations about our products, these need to be accompanied by explanations: the explanation for why ‘The map view helped customers to identify closest store’ will be valuable to any other teams designing products that use maps and helps them to make better decisions when design their UI. By sharing our explanations we allow other teams to validate them and to build upon them, and create still better explanations which in turn leads to better product design and customer experience.